AlumDeck

Run · Insights & reports

Know who is drifting away before the AGM asks.

Analytics for any period, a score from 0 to 100 for every member, and a short list of things that need attention, each one opening the people behind the number. Every figure is worked out on your own server, from your own records.

  • 5engagement bands, from New to Champion
  • 100points in the score, shared out as you decide
  • 7subjects on the analytics page
  • 5lists a custom report can start from

How it works

From the number to the people behind it.

A figure is only useful if it opens a list you can act on.

Analytics

One page for the whole year

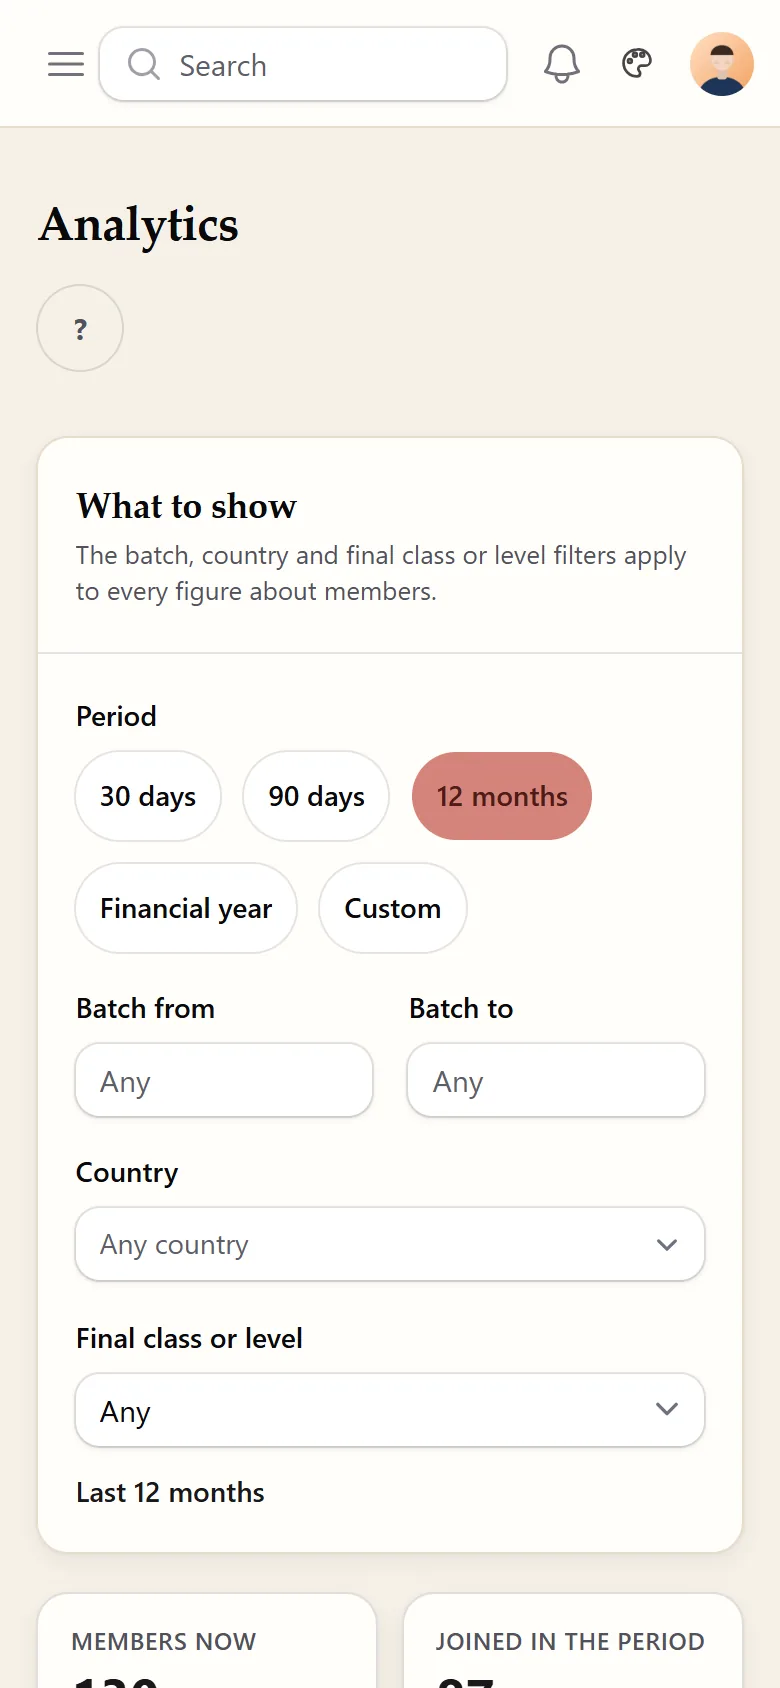
People, Analytics covers members, engagement, events, email, giving, mentoring and volunteering. Choose 30 days, 90 days, 12 months, the financial year or your own dates, and narrow it by year group, country or level. Every chart has "Show the numbers", and every table downloads as a CSV of totals.

  • Giving figures only for people allowed to see money, and per currency
  • Open and click rates for campaigns that were counted
  • A download holds totals, never names
Engagement

A score you set the rules for

Each night every member gets a score from 0 to 100, from their profile, sign-ins, community posts, events and contributions. The bands are New, Cold, Warm, Active and Champion. In Settings you decide how many of the 100 points each part is worth and where each band starts.

  • "Recompute now" applies new weights at once
  • Aim a campaign at a band, or at members who moved into it
  • The analytics page shows the bands and their trend

Insights

A short list that opens the people behind it

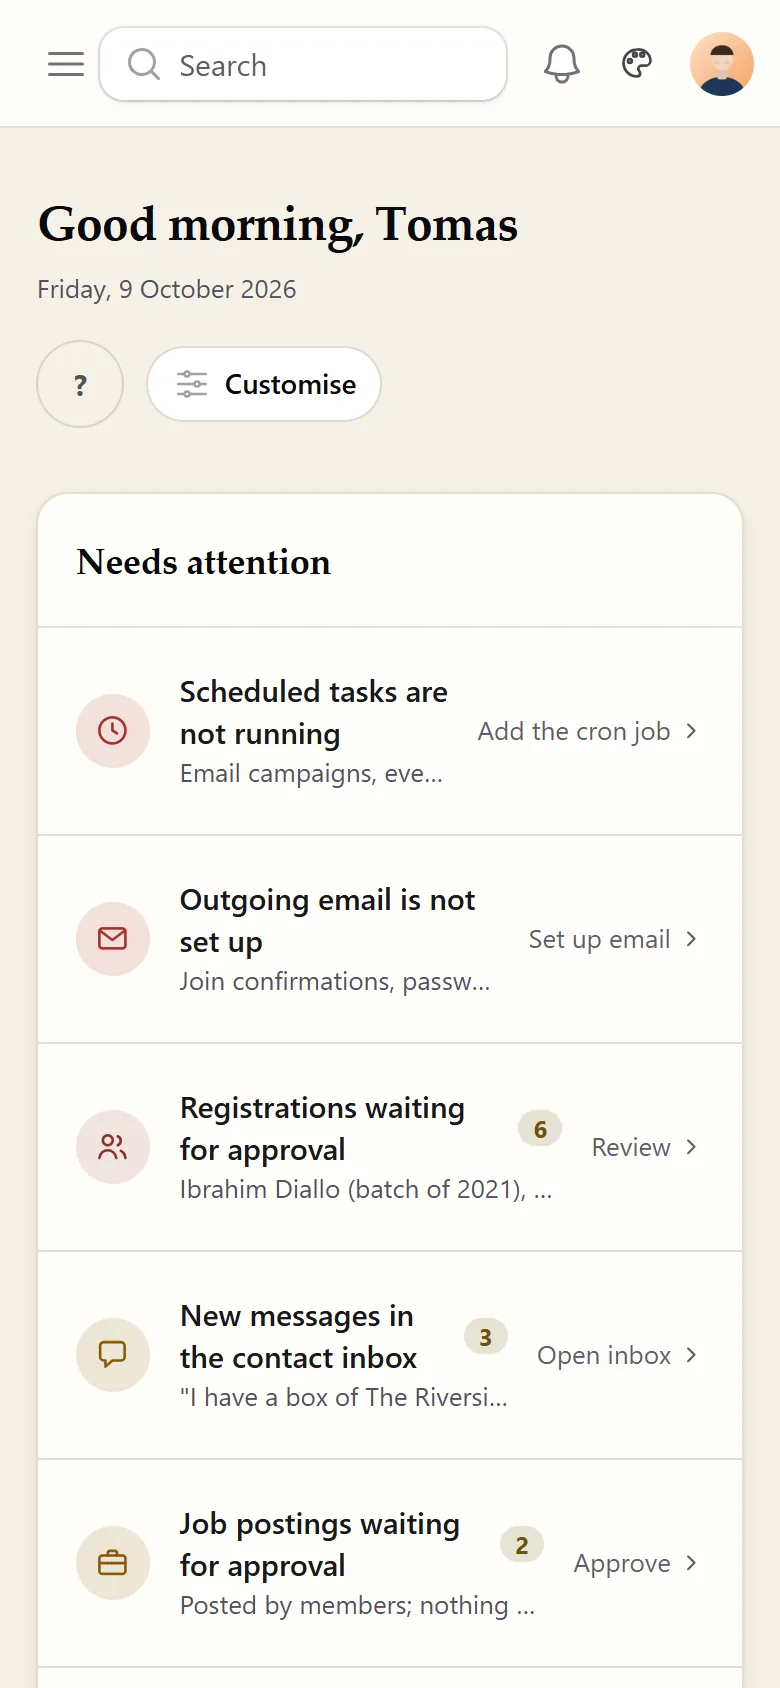
The dashboard's Needs attention card adds insights: members who went quiet this quarter, year groups that have barely joined, donors who gave last financial year but not this one, and events a week away with few replies. Each row opens the matching list, and most offer "Email these members", which starts a campaign with exactly that audience.

  • Year-group insights need your school records loaded
  • Donor insights only for people allowed to see money
  • Nothing is sent until someone writes and sends the campaign
Email, texts and WhatsApp

Reports

Reports for the treasurer and the committee

The giving report covers a financial year or your own dates: totals, donors, the average and median gift, by appeal, method and month, and donors who gave before but not this year. Once you switch reports on, a custom report lists members, gifts, events, event registrations or memberships with the columns you pick, and an annual report gathers the year's figures for you to write around.

  • A custom report by email every week or month, as a spreadsheet or a PDF
  • The annual report prints as a PDF
  • Each list needs its own area at the manage level

What comes with it

Six reports, no spreadsheet gymnastics.

The reports that come with AlumDeck
ReportWhat it showsWhere
AnalyticsMembers, engagement, events, email, giving, mentoring and volunteering for any periodPeople, Analytics
Giving reportTotals, donors, average and median per currency; by appeal, method and monthMoney, Giving report
Dues reconciliationInvoiced against received, with fees, the net amount and the overdue listMoney, Invoices
Custom reportsYour own columns and filters on members, gifts, events, registrations or memberships; by email weekly or monthlyRecords, Custom reports
Annual reportThe year's figures gathered for you, with sections you write; a PDFRecords, Annual reports
Campaign reportSent, opens, clicks for each link and unsubscribes, once counting is onPublishing, Email campaigns

Not yet

What insights and reports do not do yet.

A tag means a fix is planned. No tag means it is not.

  • Benchmarks against other institutions: your install sends us no data to compare
  • Names in an analytics download: they hold totals only
  • Scoring people by wealth, or finding alumni who never registered by searching the web
  • Custom reports and the annual report from the first day: they ship switched off, for you to switch on

FAQ

Questions committees ask about numbers

How is the engagement score worked out?

Each night every member gets a score from 0 to 100, from five things: their profile, their sign-ins, their community posts, the events they came to and their contributions. You set how much each counts, as long as the five add up to 100, and where the bands start. "Recompute now" applies a change at once.

Can a report show who gave how much?

Only to people allowed to see money. Giving figures on the analytics page, giving conditions in an audience and the gifts list in a custom report are all hidden from everyone else. Analytics downloads are totals, never names.

Can a report arrive by email?

Yes. A custom report can be emailed every week, on Mondays, or every month, on the 1st, as a spreadsheet or a PDF, to staff who may see it. Someone who loses that access stops receiving it.

Does AlumDeck compare us with other institutions?

No. Your install sends us no data, so there is nothing to compare. Every figure is about your own members, worked out on your own server.

Open the analytics page in the demo.

Sign in as the administrator and open People, Analytics: 130 invented members, their engagement bands and what they did this year.

Sign-in details on the demo pageResets every night

Type a word, or start with one of these pages.

↑ ↓ moveEnter openEsc close